
Popularity strongly influences how these 39 GrowDiaries strains group together, and the groups overlap substantially. I would use them to describe this sample, not as natural strain categories or a ranking of quality.
What the three groups show
These are the original analysis's reported averages, rounded as reported. THC and expected yield are listing values; ratings and participation counts come from the platform. They are not controlled comparisons.
| Group | Strain names | Reported averages | What stands out |
|---|---|---|---|
| Cluster 0: higher advertised THC 13 strains | Permanent Marker, Apple Fritter, Biscotti, Oreoz, Sour Diesel, Wedding Cake, Bruce Banner, Mac 1, Durban Poison, Cookies Kush, AK-47, Slurricane, Lemon Skunk | THC 23.5%; expected yield 318 g; rating 8.94/10; 83 growers; 33 reviews | Highest advertised THC, expected yield, and rating, with less community participation. |
| Cluster 1: highest participation 6 strains | Zoap, Dosidos, OG Kush, Purple Punch, White Widow, Blue Dream | 532 growers; 212 reviews; 274 harvests; flowering 70 days; 0.60 g/W; CBD 0.97%; indica 62% | Much greater participation, alongside the shortest reported flowering time and highest reported g/W. |
| Cluster 2: largest group 20 strains | Zkittlez, Gorilla Glue, Runtz, Granddaddy Purple, Lemon Cherry Gelato, Gelato, RS11, Tropicana Cookies, Blueberry, Girl Scout Cookies, Super Lemon Haze, Jack Herer, Amnesia Haze, Green Crack, Super Silver Haze, Pineapple Express, Cheese, Purple Kush, Bubble Gum, Cinderella 99 | THC 18.9%; expected yield 273 g; 249 growers; 94 reviews; 0.46 g/W | More strains fall here than in either other group; its averages do not make it a distinct biological category. |
Platform difficulty labels also differed: Cluster 0 had 7 “difficult,” 6 “moderate,” and zero “easy”; Cluster 1 had 4 of 6 “easy.” These are platform labels, not results from comparable conditions. The 0.60 versus 0.46 g/W difference is about 30% in reported yield per rated watt, not a demonstrated difference in electricity cost.
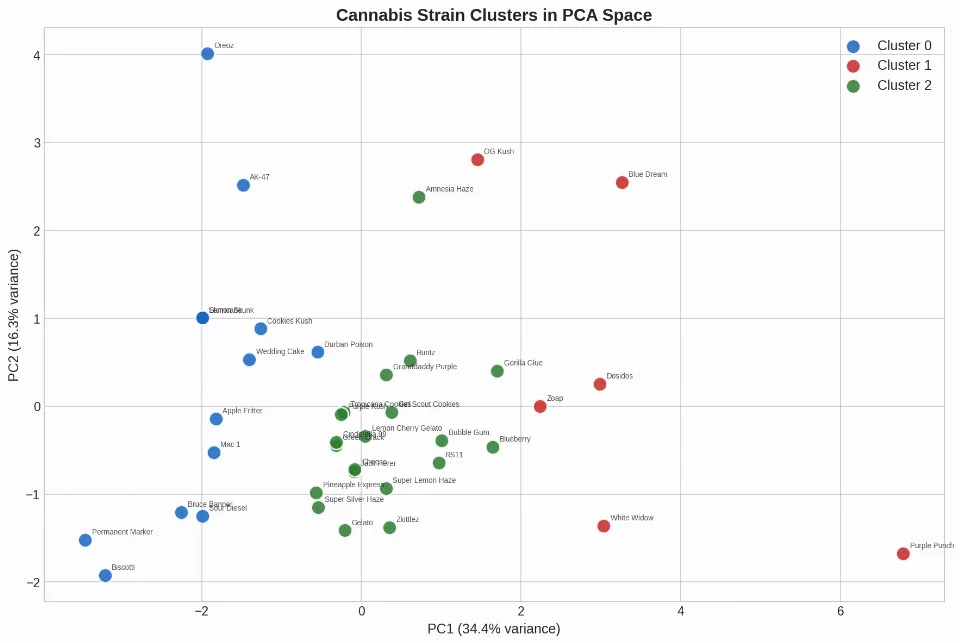
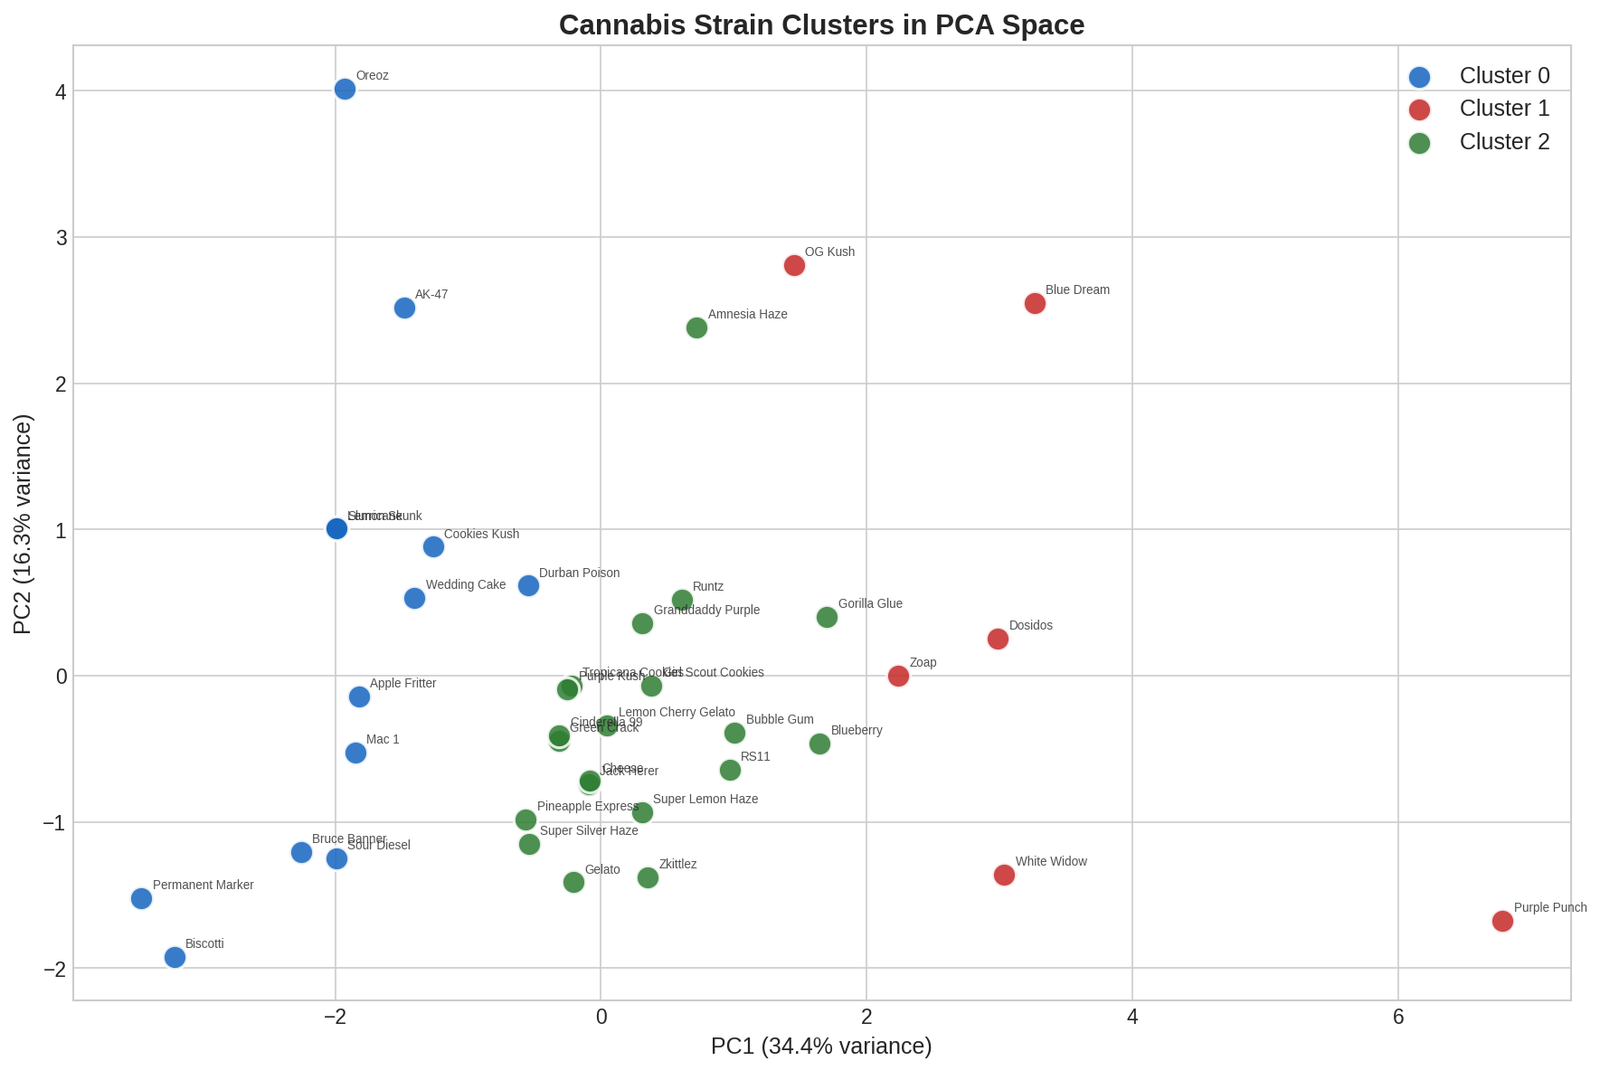
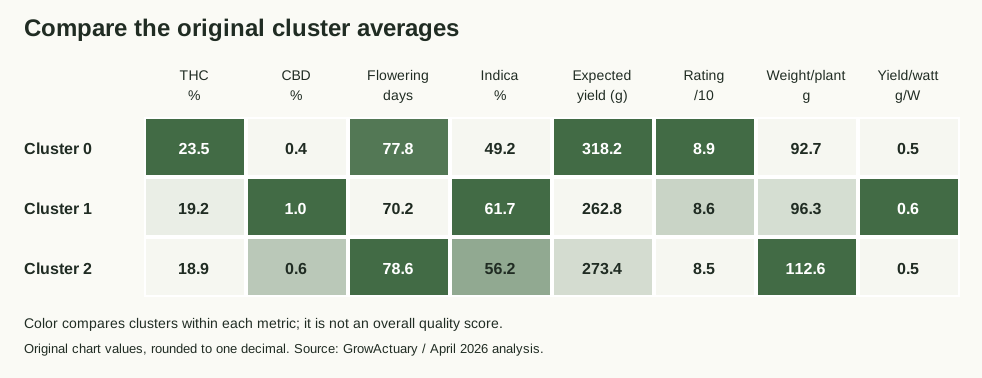
Open vector chartDownload chart values (CSV)
Why the separation is weak
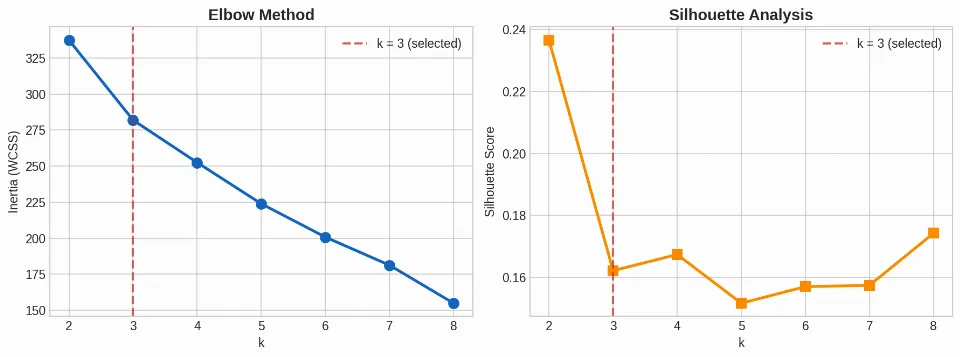
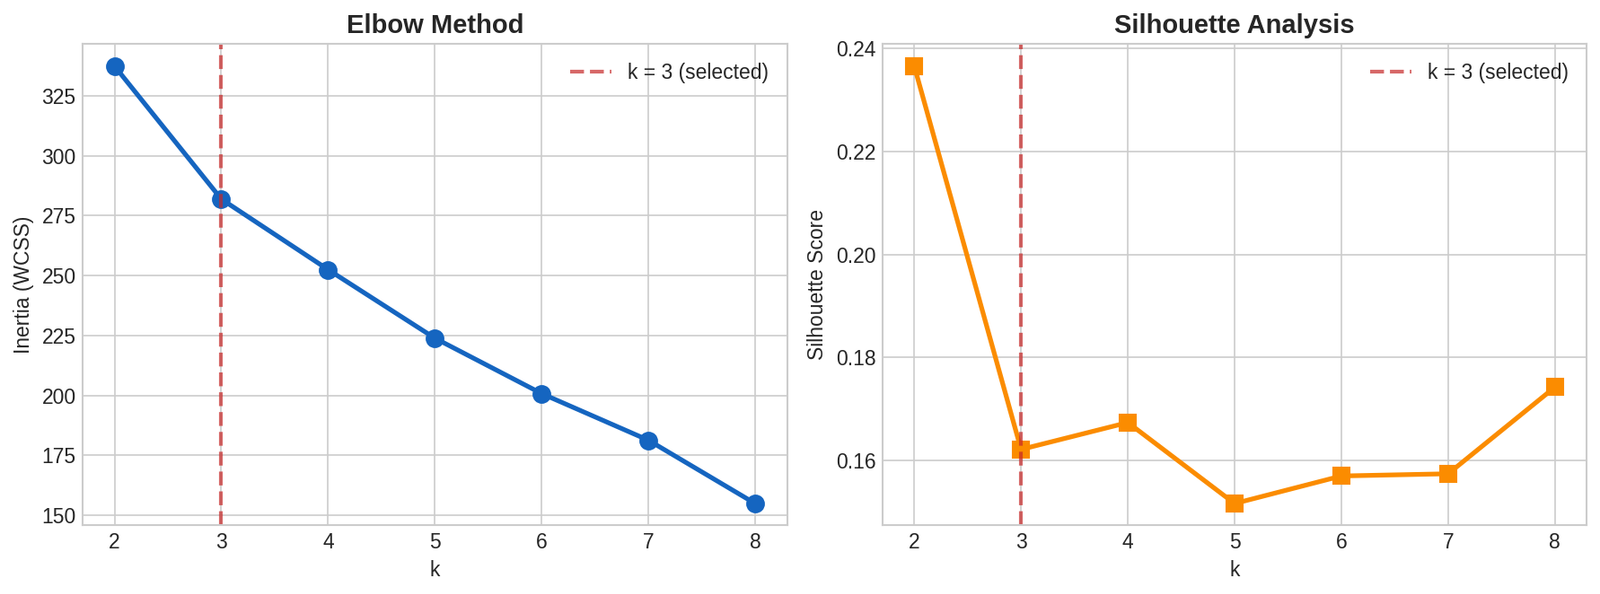
The strongest silhouette score was 0.237 for two clusters; the selected three-cluster solution scored 0.162. Three groups offered more detail but weaker separation by this measure. The modest scores do not support treating assignments as firm boundaries.
Reviews, harvests, and grower counts entered as separate features even though their pairwise correlations exceed 0.95. Standardizing their scales does not remove that repeated popularity influence. The original PCA interpretation identified community participation as the main influence on the first component.
No rerun using one popularity measure or excluding popularity has tested the groups' stability under those changes.
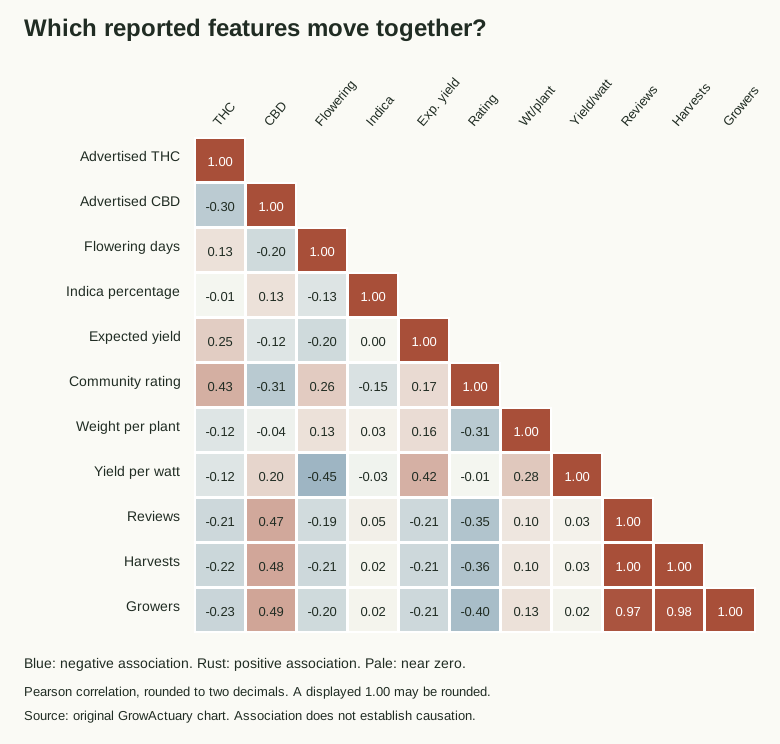
Open vector chartDownload chart values (CSV)
How the analysis was run
Data collected April 25, 2026, from GrowDiaries. The sample contains 39 of the first 40 strains listed by popularity; Cereal Milk was excluded because its community rating was missing.
K-Means used 11 standardized numeric features: advertised THC and CBD, flowering days, indica percentage, expected yield, average community rating, reported weight per plant, reported g/W, reviews, harvests, and growers. Missing rating data was excluded, not entered as zero.
The analysis tested k = 2 through 8. Scikit-learn settings were n_init=30 and random_state=42; PCA supplied the two-dimensional visualization. The elbow plot helped motivate k = 3, alongside interpretability. Python 3, pandas, matplotlib, and seaborn supported the analysis.
What I would take from this
Use the table to compare reported traits and platform participation. The cluster labels do not establish a quality ranking, and the analysis does not show that the groups would persist in a broader sample or with different inputs.